Supplier Analytics
Details of analytics available on the supplier platform.
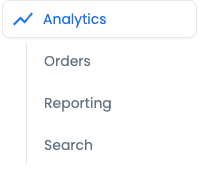
Suppliers can view analytics directly from the landing page, or by clicking on the top navigation menu option. There are three different tabs available: Orders, Reporting and Search Analytics.
- Orders - order history with full order details for each order
- Reporting - insights into what suppliers sell and where they sell it
- Search Analytics - search analytics for each store the supplier is connected to
Summary Page
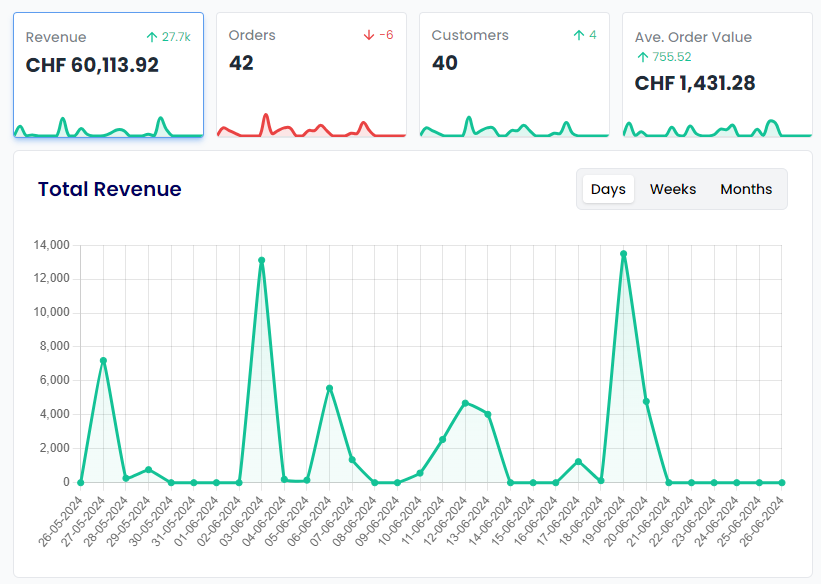
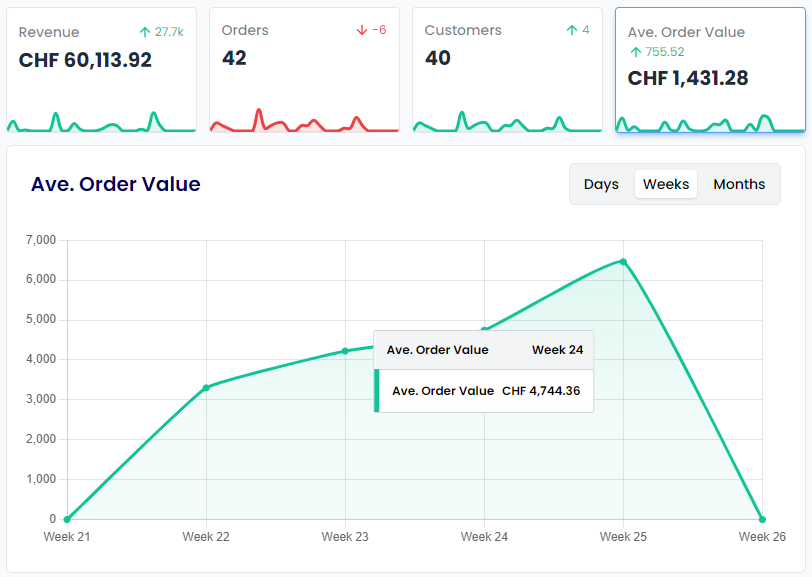
Key Metrics
At the top of the summary page, suppliers can view 4 metrics for the time period specified in the top right with the date picker. The metric tiles also contain the change versus the previous period of time.
Below the metrics, a breakdown of the metric over time can be viewed in the chart for different levels of granularity (days, weeks and months).
Clicking on a different metric tile will change the chart to display that metric over time. Data points on the charts can be hovered over to view a tooltip containing the exact data. The 4 metrics are:
- Revenue - the total amount spent by buyers ordering the products of this supplier
- Orders - the total number of orders placed by buyers for this supplier
- Customers - the total number of unique buyers that have placed orders for this supplier
- Avg. Order Value - the average amount spent by buyers on an order for this supplier
Activity Panel
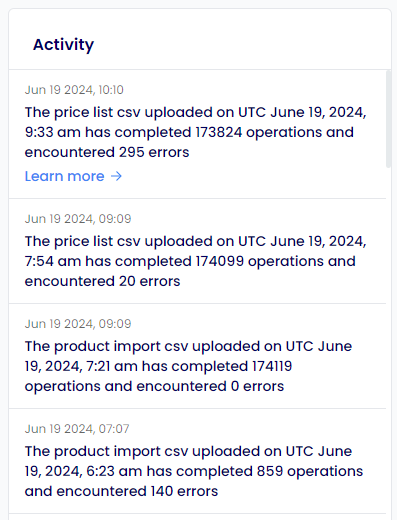
In the activity panel, suppliers can view their most recent activity, with respect to completed file imports such as product files and price list files. If any imports have errors, Learn more -> can be clicked to directly download the errors file, containing the original data appended with an errors column.
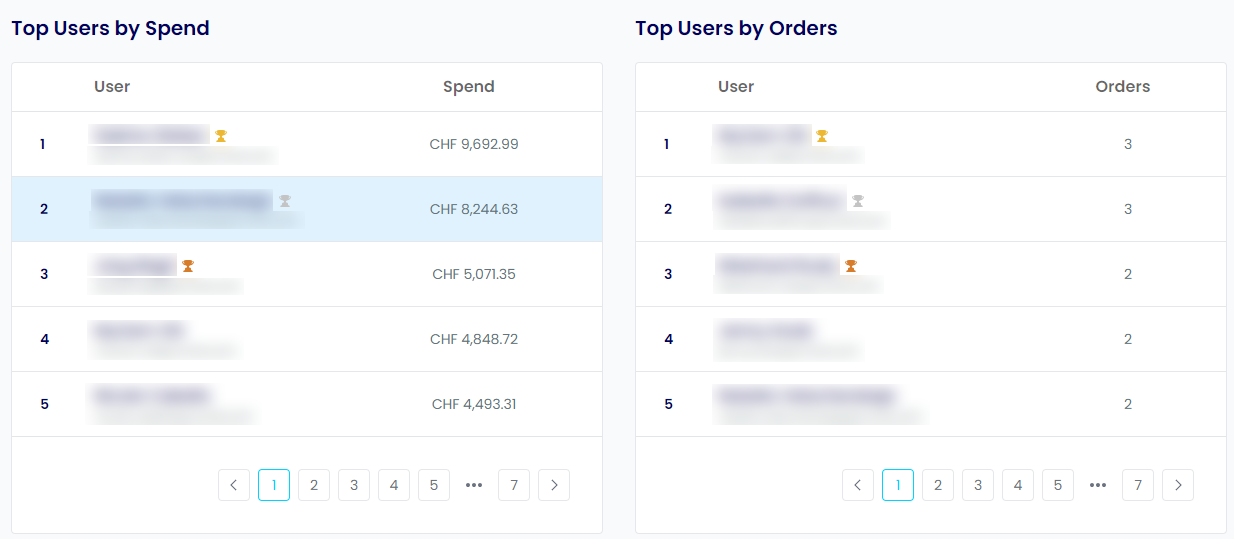
Top Users
At the bottom of the summary page, suppliers can view the top users by spend and top users by orders. These tables show lists of buyers sorted from highest to lowest for spend and orders with this supplier respectively.
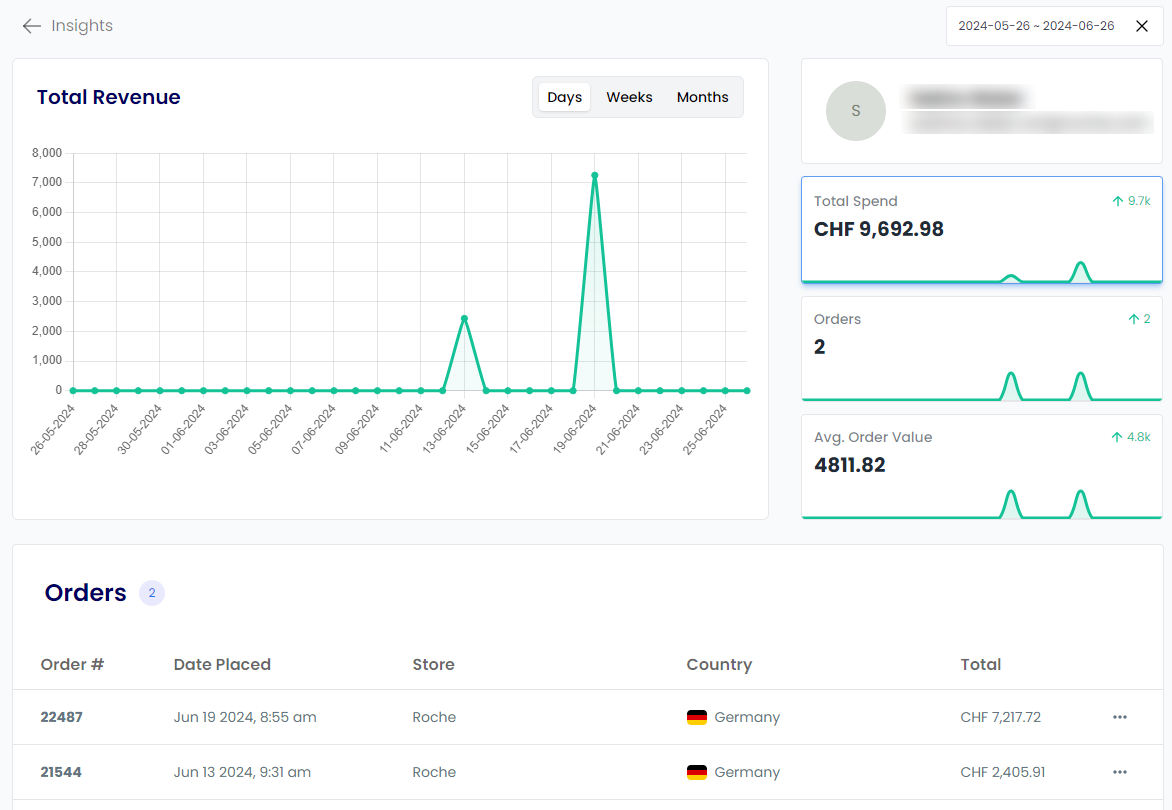
Clicking on a user will take you to a user insights page, which displays summary metrics and accompanying charts over time for Revenue, Orders and Average Order Value. The page can be filtered by date range by using the date picker at the top. Clicking on a metric tile will display the corresponding chart. Different levels of granularity can be selected for each chart, and hovering over a data point will display a tooltip with the exact data.
Additionally, the user insights page displays the orders specific to that user. Clicking on an order will take you to the order details page, which contains information such as the products ordered, who they were ordered by, when they were ordered and where they were ordered to. Clicking on a product will take you to the appropriate product details page.
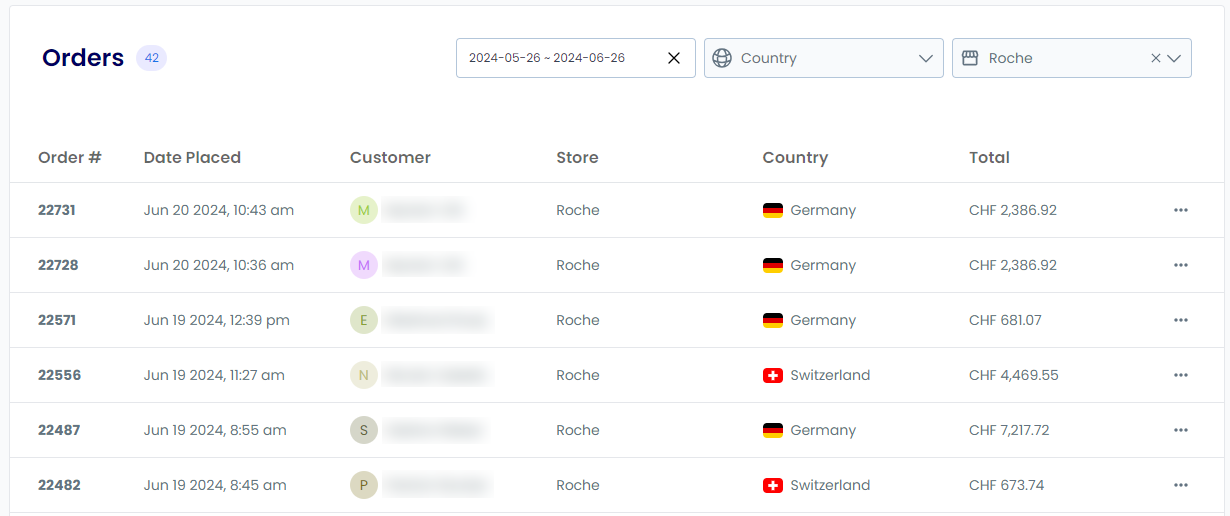
Orders
Suppliers can view a full history of the orders they have received. The orders can be filtered by date range, country and store. Clicking on an order will take you to the order details page, which contains information such as the products ordered, who they were ordered by, when they were ordered and where they were ordered to. Clicking on a product will take you to the appropriate product details page.
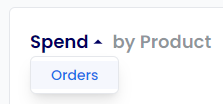
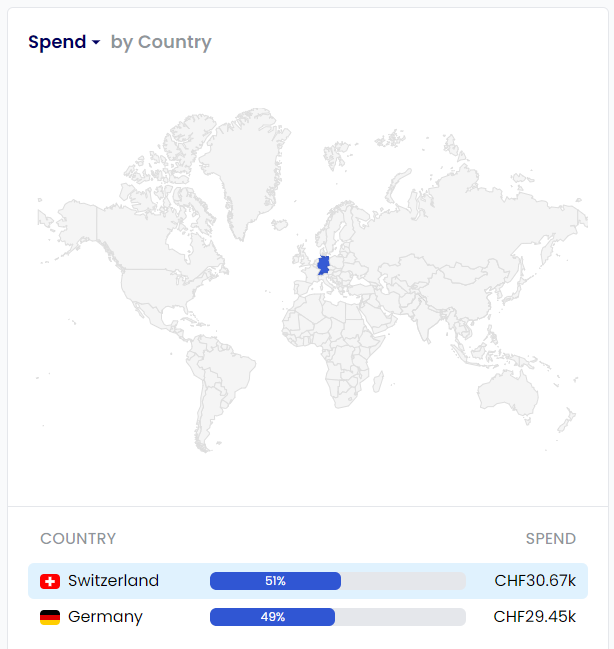
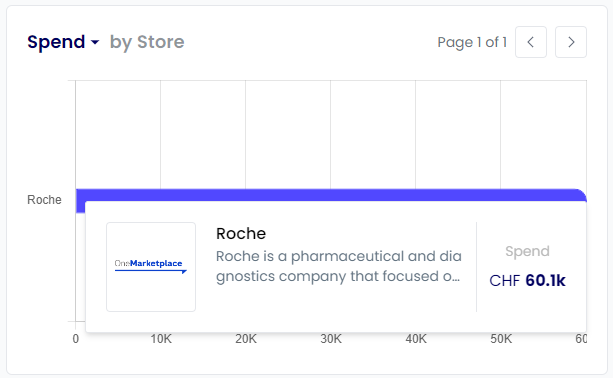
Reporting
On the reporting tab, suppliers can learn what they sell and where they sell it. Both total spend and the number of orders can be viewed at the country, store and product level. The data can be viewed for specific date ranges by selecting them with the date picker at the top of the page. Additionally, country and store filters can be applied to the entire page.
Tooltips can be viewed by hovering over countries on the map or bars in the bar charts. Clicking a country row will zoom into that area of the map, and clicking a bar in the products chart will take you to the relevant product page.
Search Analytics
Overview
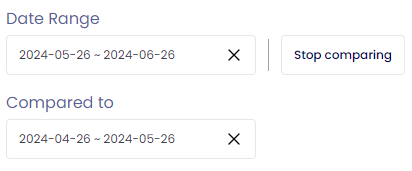
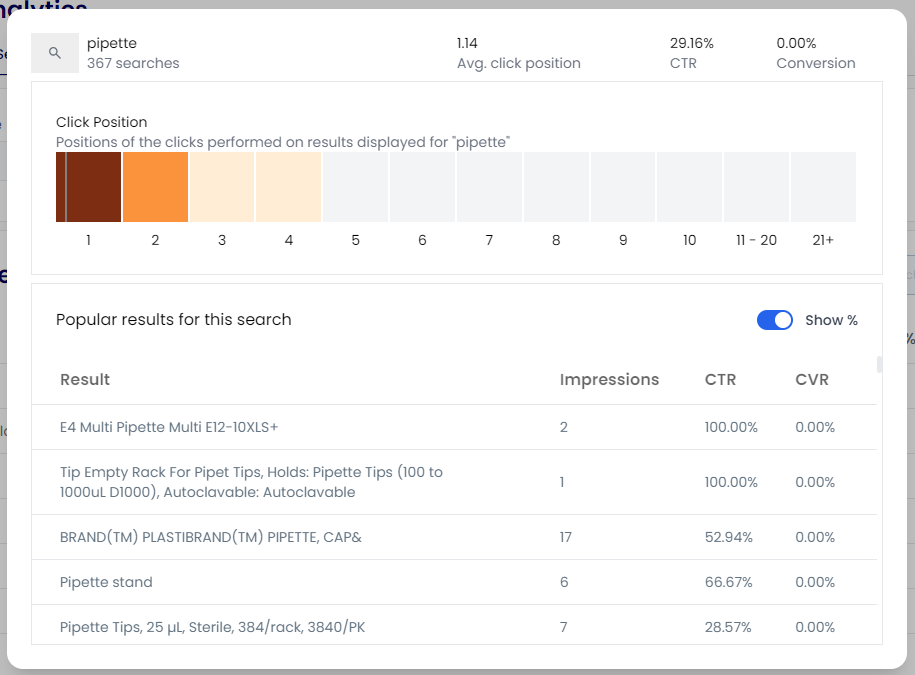
The overview search analytics tab contains charts displaying multiple summary search metrics over time. The time period can be adjusted using the date picker, and a comparion period can be added by clicking Comparison Mode. This tab also displays click position information, which shows a heatmap of how many clicks each position of the search results receives.
- Total Sessions - the total number of user sessions
- Total Searches - the total number of user searches
- No Results Rate - the percentage of searches that returned zero results
- Click Rate - the percentage of searches that lead to a product page being viewed
- Conversion Rate - the percentage of product page views that lead to the product being added to basket
- No Clicks Rate - the percentage of searches that do not lead to a product page being viewed
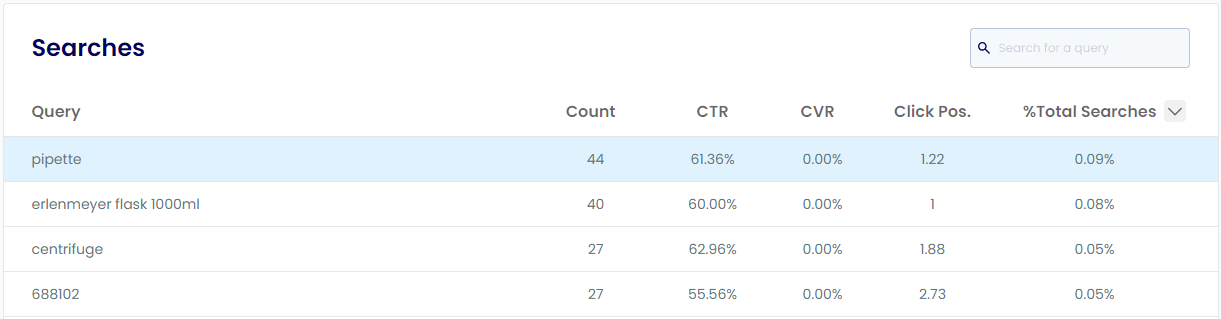
Searches
The Searches tab displays data for individual search queries. The table can be sorted ascending or descending for count, CVR (conversion rate) and %Total Searches (% of the total searches). CTR is the click-through rate. Clicking on a query will display more information for that query, such as click position
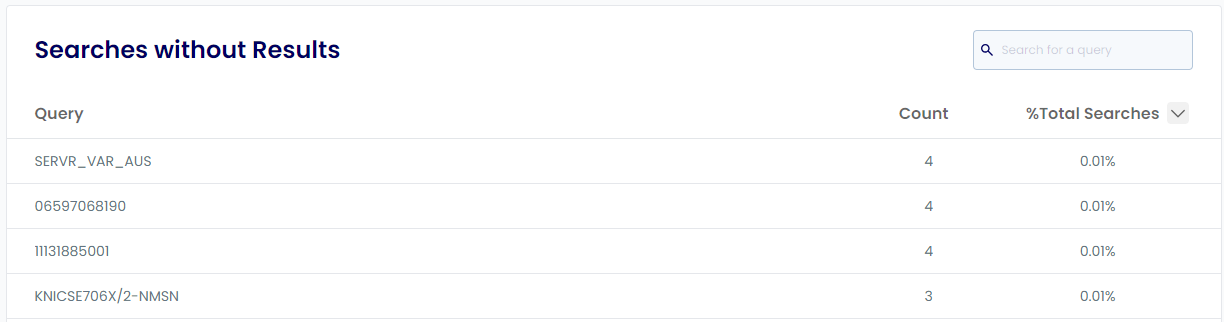
Searches Without Results
The Searches without Results tab displays queries that did not return any results.
Interactive Tutorial
For a more detailed walkthrough of the supplier analysis features, watch this interactive tutorial: