Procurement Analytics
Learn how to use the analytics features to gain insights into your procurement operations and make data-driven decisions.
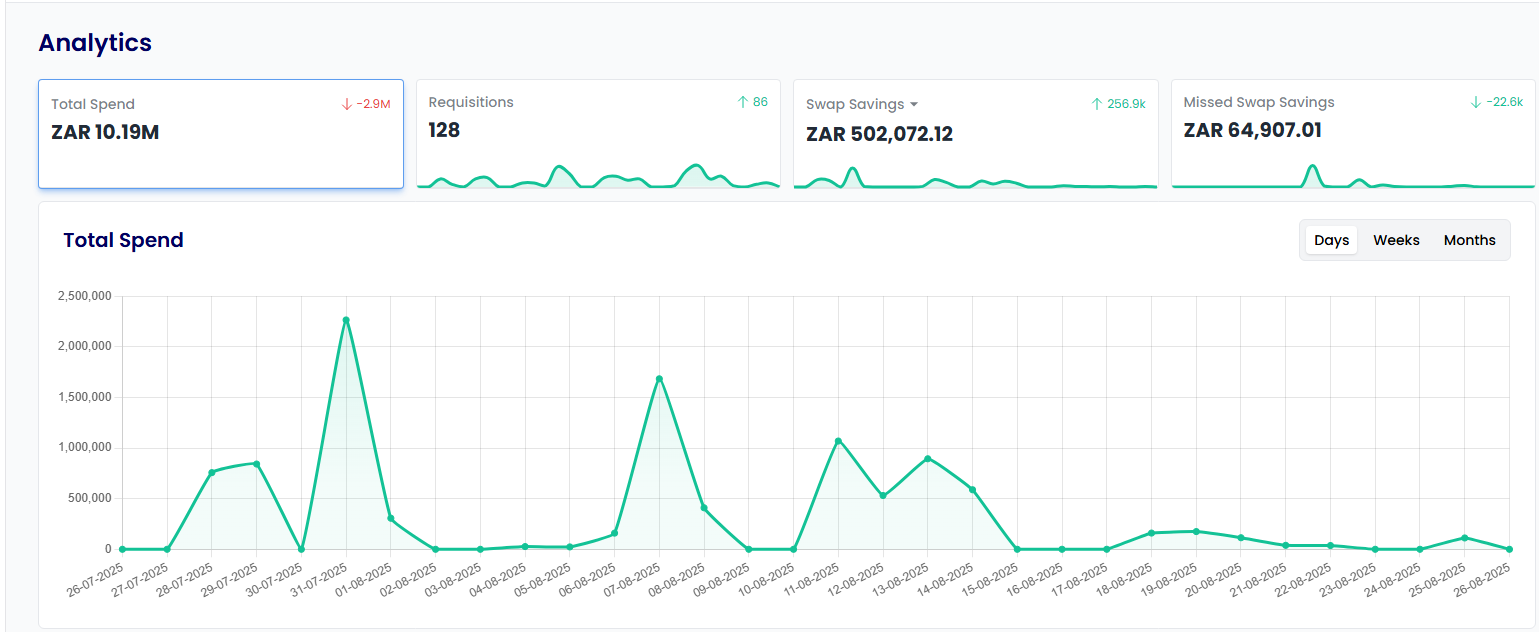
Summary
The Procurement Analytics dashboard provides insights into your procurement operations. Track spending, monitor savings, and evaluate supplier performance to optimize your procurement processes.
Key Metrics
Monitor critical performance indicators:
- Total spend: Track overall procurement expenditure across all categories and suppliers
- Number of requisitions: Monitor procurement activity and process efficiency
- Savings opportunities: Identify potential cost reductions and optimization opportunities
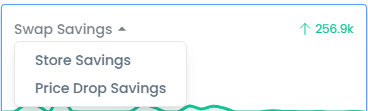
Savings Analysis
Track different types of savings to maximize cost reduction:
- Swap savings: Switch to more cost-effective alternatives when available
- Store savings: Track negotiated discounts versus public pricing
- Price Drop Savings: Monitor price reductions compared to previous orders
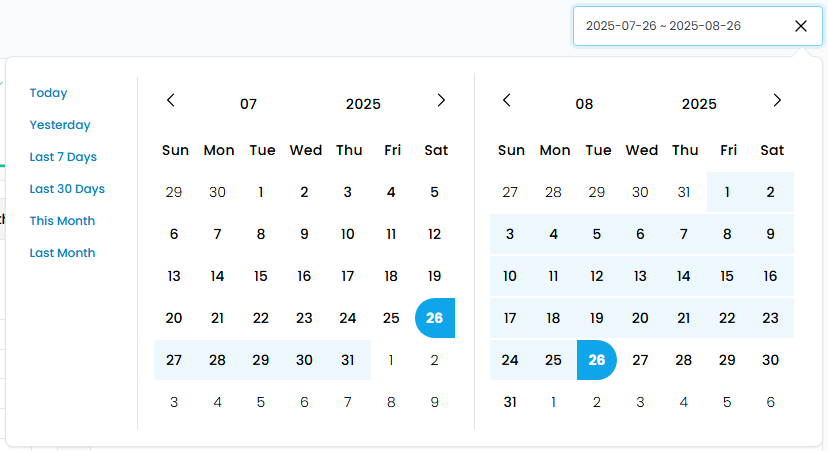
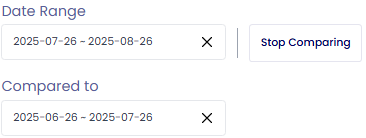
Date Range and Activity Analysis
Date Filtering
Use the date selector to:
- Compare performance across different periods
- Identify seasonal trends
- Track year-over-year improvements
- Analyze the impact of specific initiatives
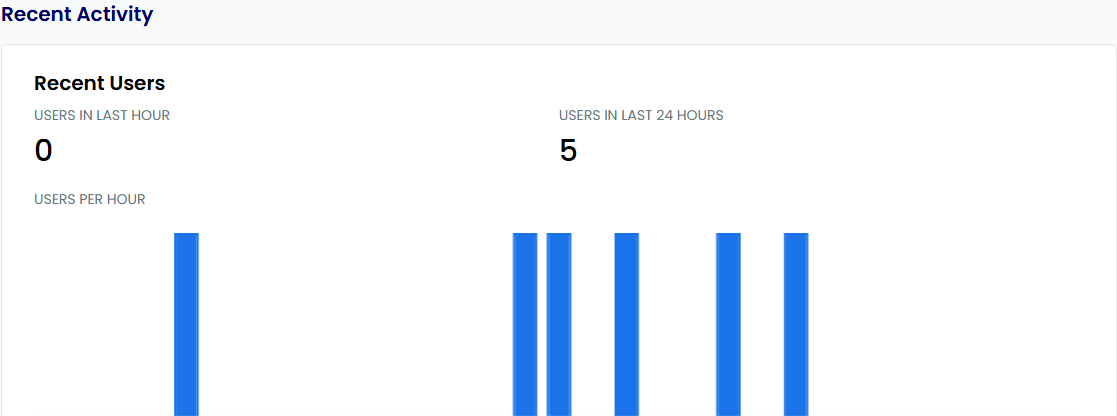
Recent Activity
Monitor platform engagement:
- Track user adoption rates
- Identify most active users and departments
- Spot potential training needs
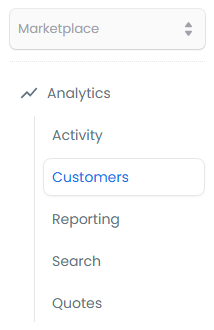
Customer Insights
The Customers section provides buyer behavior analysis:
- Track individual and team spending patterns
- Identify high-performing users and teams
- Monitor compliance with procurement policies
- Discover opportunities for process improvement
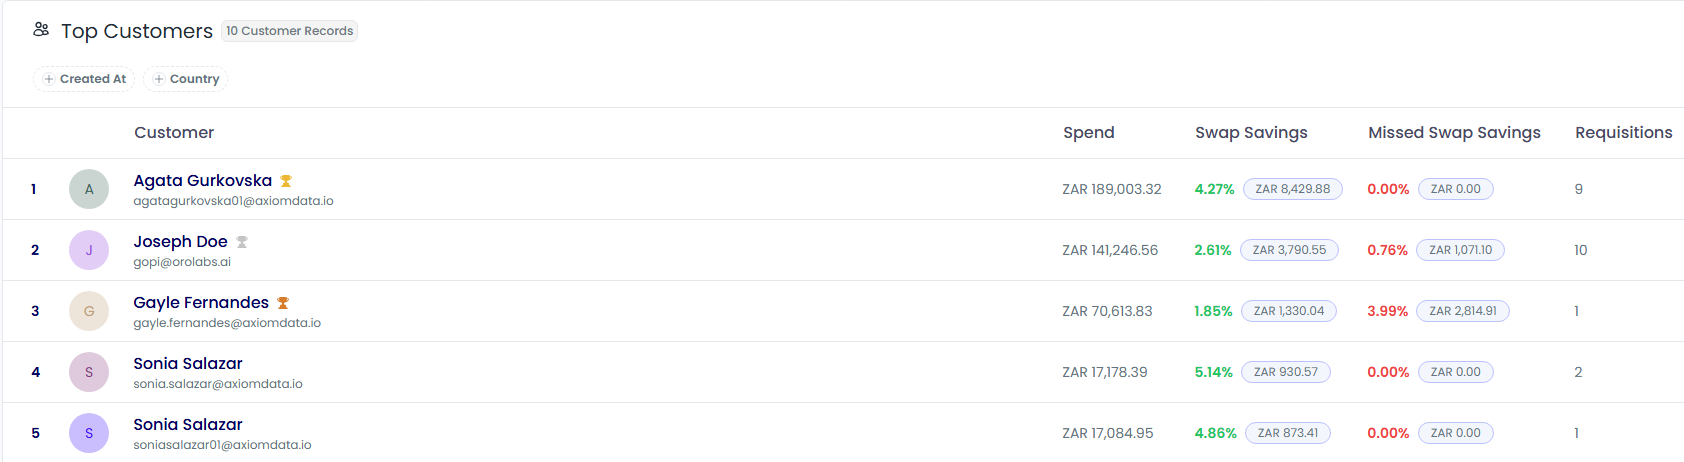
Filtering Options
Customize your analysis:
- Created at: Track new user onboarding and adoption
- Country: Compare performance across different regions

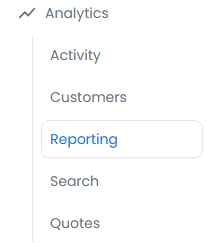
Detailed Reporting
The Reporting section provides insights across multiple dimensions:
- Countries: Compare regional performance and identify market-specific trends
- Products: Track product category performance and identify optimization opportunities
- Suppliers: Evaluate supplier relationships and performance metrics
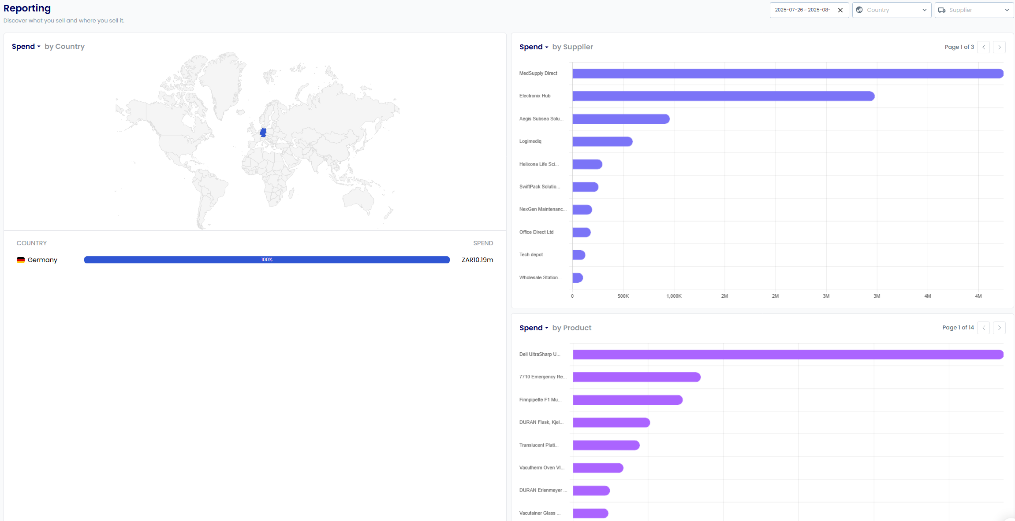
Advanced Filtering
Refine your analysis with filters:
- Date: Analyze trends over specific time periods
- Country: Focus on regional performance
- Supplier: Evaluate individual supplier relationships

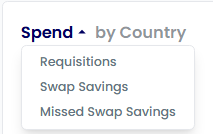
Report Customization
Create targeted reports focusing on key metrics:
- Spend: Track and analyze expenditure patterns
- Requisitions: Monitor procurement process efficiency
- Swap Savings: Identify and track cost reduction opportunities
- Missed Swap Savings: Discover untapped saving potential
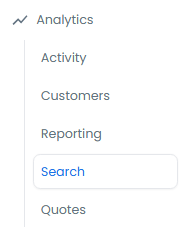
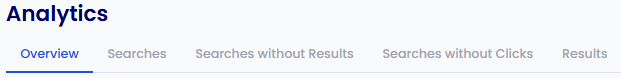
Search Analytics
The Search section reveals user behavior patterns:
- Understand what users are looking for
- Identify gaps in product catalogs
- Improve search functionality
- Optimize the procurement experience
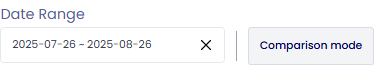
Comparison Mode
Benchmark performance:
- Compare different time periods
- Identify trends and patterns
- Measure the impact of improvements
- Track progress against goals
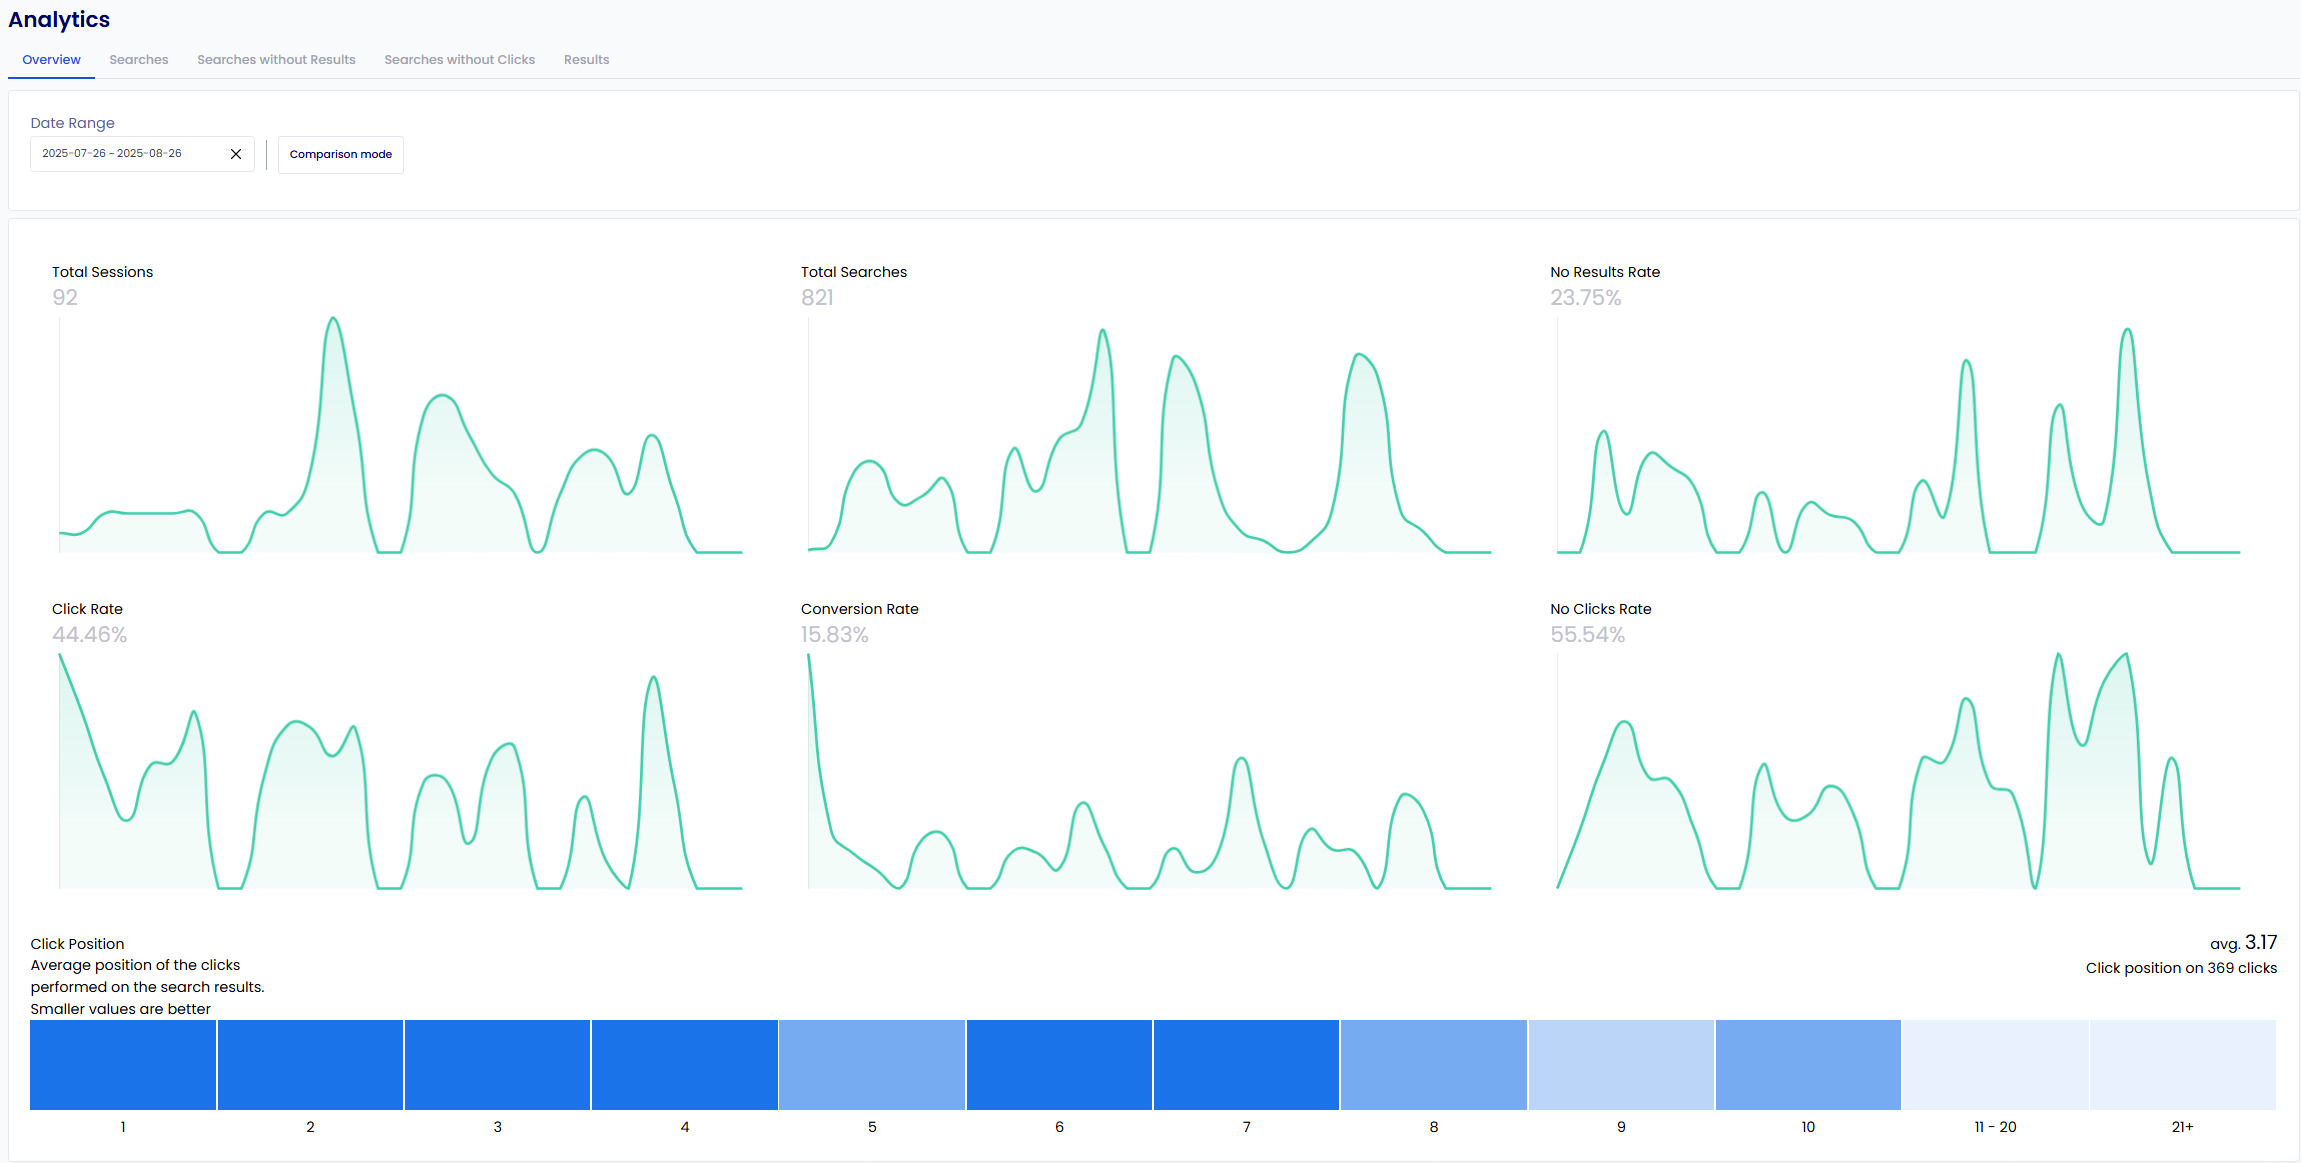
Search Metrics Analysis
Key metrics to optimize the procurement experience:
- Total Searches: Track overall platform usage
- Searches without Results: Identify catalog gaps and improvement opportunities
- Searches without Clicks: Spot mismatches between user intent and search results
- Results Quality: Measure and improve search effectiveness
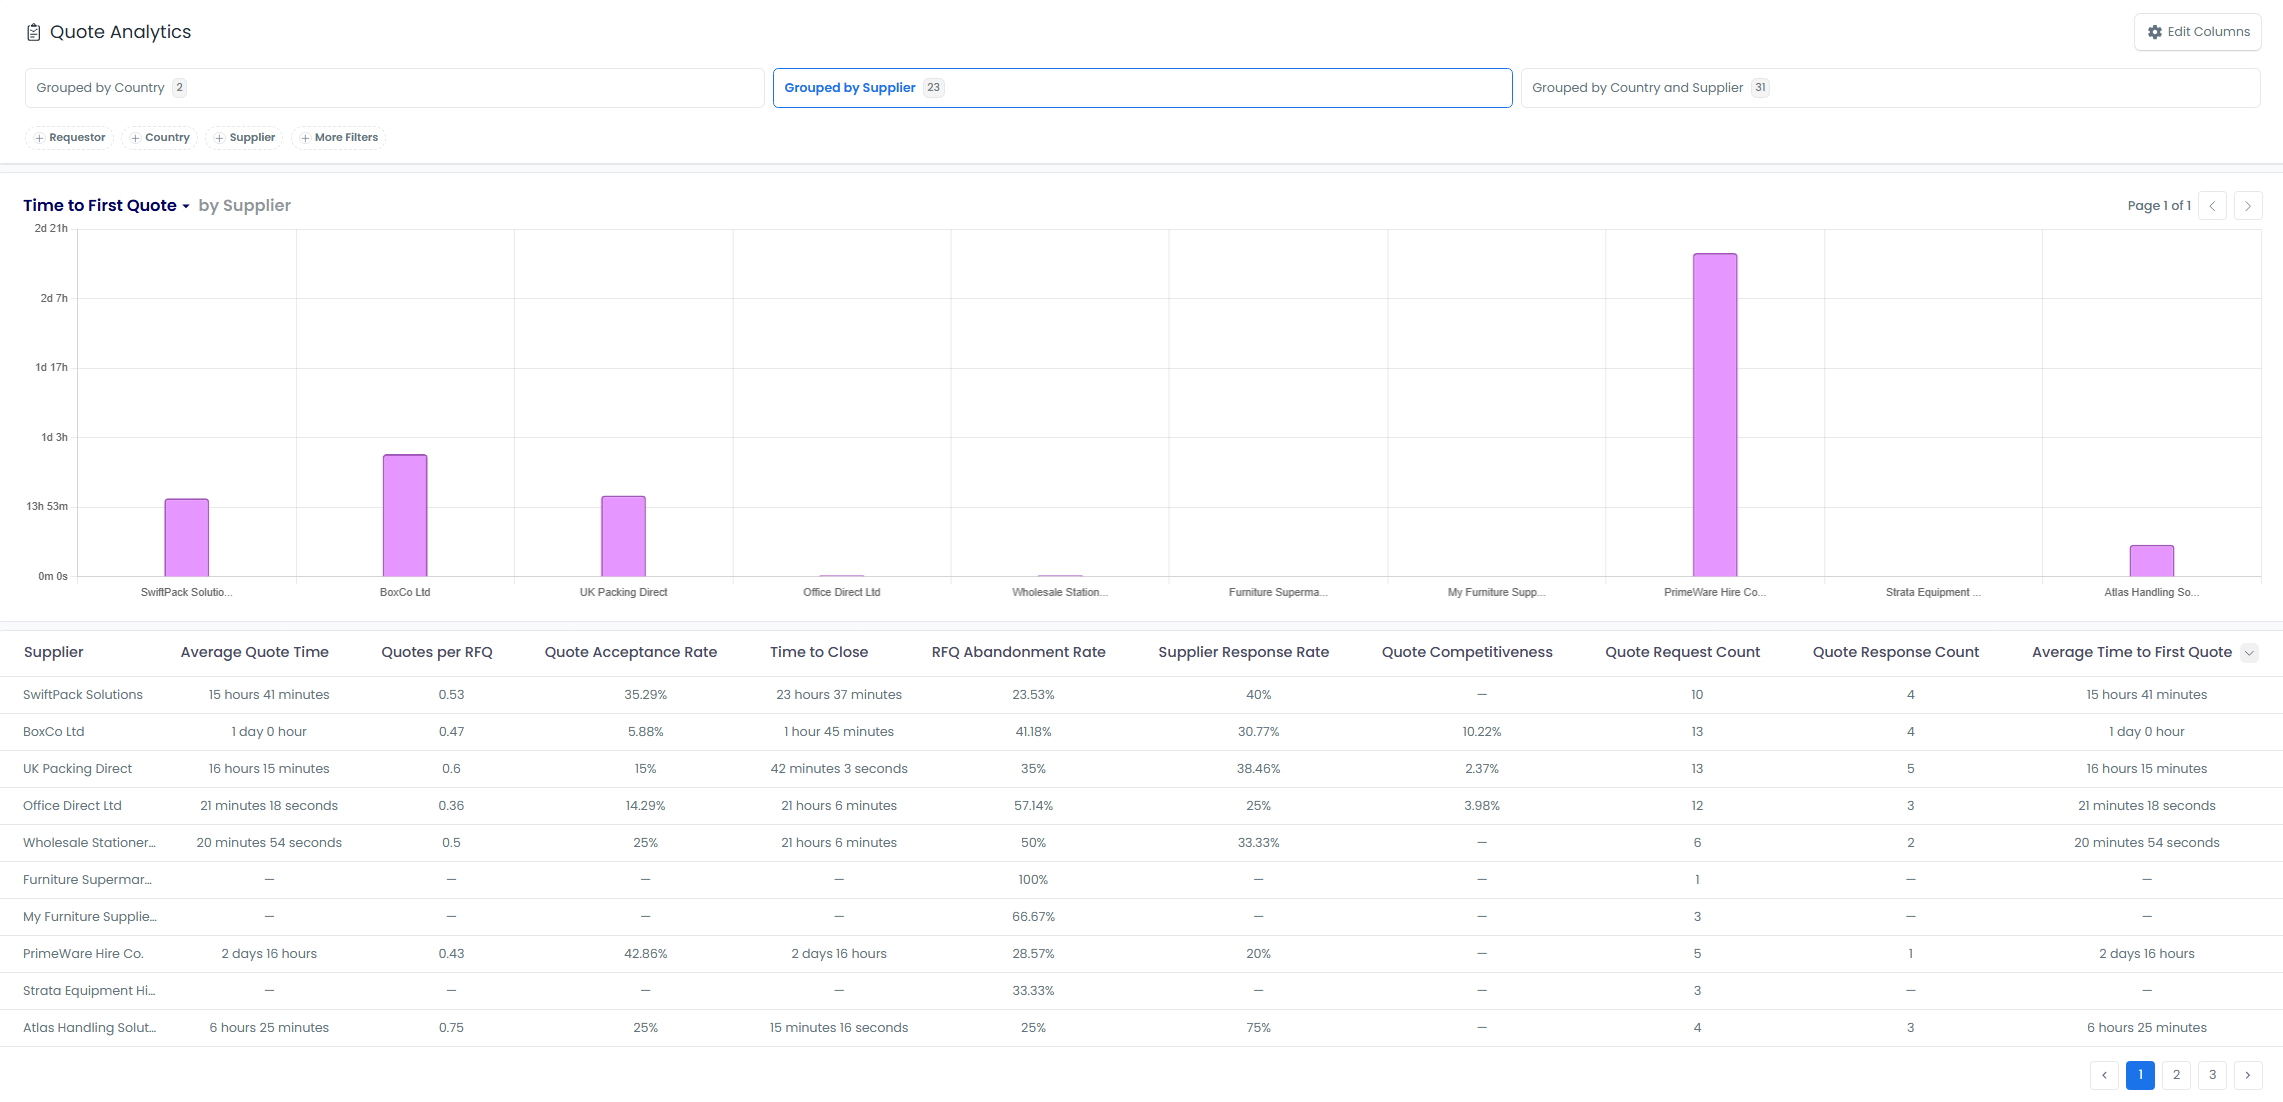
Quote Analysis
The Quotes section helps optimize your RFQ process:
- Track supplier response times
- Monitor quote quality
- Identify bottlenecks
- Improve quote management efficiency
Grouping Options
Analyze quote data from multiple perspectives:
- Country: Understand regional quote patterns
- Supplier: Evaluate supplier responsiveness
- Combined View: Get comprehensive insights across regions and suppliers
Quote Filters
Fine-tune your quote analysis:
- Requestor: Track individual buyer performance
- Country: Compare regional quote processes
- Supplier: Evaluate supplier quote behavior
- Custom Filters: Create specialized views for specific needs

Interactive Tutorial
For a detailed walkthrough of the analytics features, watch this interactive tutorial:
- Summary
- Key Metrics
- Savings Analysis
- Date Range and Activity Analysis
- Date Filtering
- Recent Activity
- Customer Insights
- Filtering Options
- Detailed Reporting
- Advanced Filtering
- Report Customization
- Search Analytics
- Comparison Mode
- Search Metrics Analysis
- Quote Analysis
- Grouping Options
- Quote Filters
- Interactive Tutorial